Accelerating Growth on the Margin
I bring a pedigree built across the industry's most demanding environments, and a measurement-first approach that ensures every dollar works. That foundation is what makes the shift to AI-powered marketing an advantage rather than a risk.

Growth Strategy
|
Demand Generation
|
Go-To-Market
|
Revenue Optimization
|
Cross-Functional Leadership
|
Predictive Modeling
|
Forecasting
|
Marketing Analytics
|
Growth Strategy | Demand Generation | Go-To-Market | Revenue Optimization | Cross-Functional Leadership | Predictive Modeling | Forecasting | Marketing Analytics |
Case Studies

Growth & Demand Gen
Building acquisition programs from 0 to 1 across space, fintech and financial services.
Case Study:
OnePay launched into a crowded fintech market with one structural advantage: Walmart. The challenge was building a growth program that turned that distribution into customers, fast.
We scaled to one million customers in roughly six months, with CAC running 40% below industry benchmarks. The engine was three-part: Walmart's native onboarding experience put the product in front of a captive, high-intent audience; paid social and search captured the demand that Walmart's scale generated organically. With a Super Bowl's worth of monthly impressions flowing through Walmart, the awareness problem largely solved itself, our job was making sure the intent on the backend converted efficiently.

Performance Optimization
Scaling acquisition efficiently, then optimizing for the customers worth keeping.
Case Study:
Bank of the West had no meaningful forecasting capability, a bare-bones martech stack, and no clear line between spend and business outcomes. The mandate was growth with no incremental budget.
The first thing I built was a forecast. Using polynomial regression, I mapped the diminishing returns curve for every marketing channel, identifying the point at which the next dollar invested would perform better somewhere else. That model became the operating system for budget allocation.
We scaled fast. In one year, digital contribution to total checking originations grew 246% while spending less than the prior year, moving Bank of the West from near last place to Industry Leader in Curinos's blind study of digital acquisition across financial services.
Once we had scale, we turned to value. By scoring applicants during the application process on retention and value indicators and optimizing toward the highest-value cohorts, we increased revenue per account by 12%. The no-incremental-budget constraint turned out to be the point. It forced a measurement-first approach that made every subsequent dollar more defensible, and ultimately made the case for investing more.
Measurement & Attribution
Designing systems that tie marketing investment to business outcomes.
Case Study:
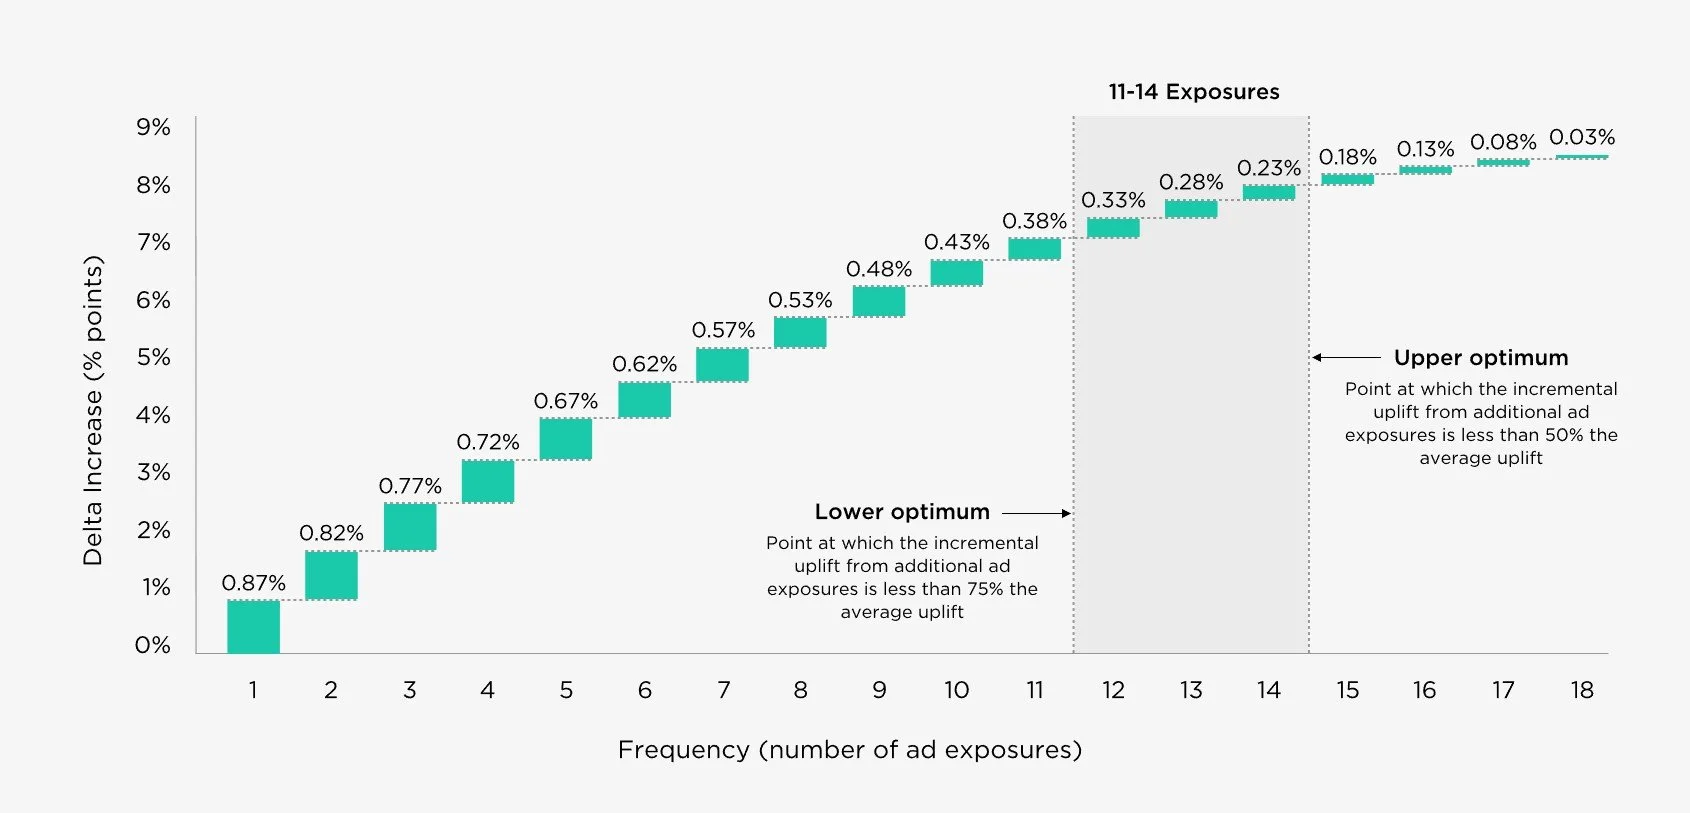
Meta's global marketing organization was managing roughly $1 billion in ad spend across owned and earned channels. The problem wasn't investment, it was knowing whether that investment was working, and at what point additional spend stopped pulling its weight.
Media Sufficiency answered that question. The methodology identified the minimum threshold required to drive meaningful purchase intent and the upper bound beyond which additional spend produced diminishing returns. Deployed across Meta's U.S. marketing endeavors, it gave teams a clear signal: you're underinvested, you're efficient, or you're leaving money on the table.
At billion-dollar scale, even a 1-2% efficiency gain is material. Media Sufficiency drove improvements in spend efficiency that justified the investment in measurement infrastructure many times over.
Let’s Build Something Together
Get the answers you need to unlock the next stage of growth for your business.
Book a free consultation today.